The Story of the AIGA Design Educators Survey


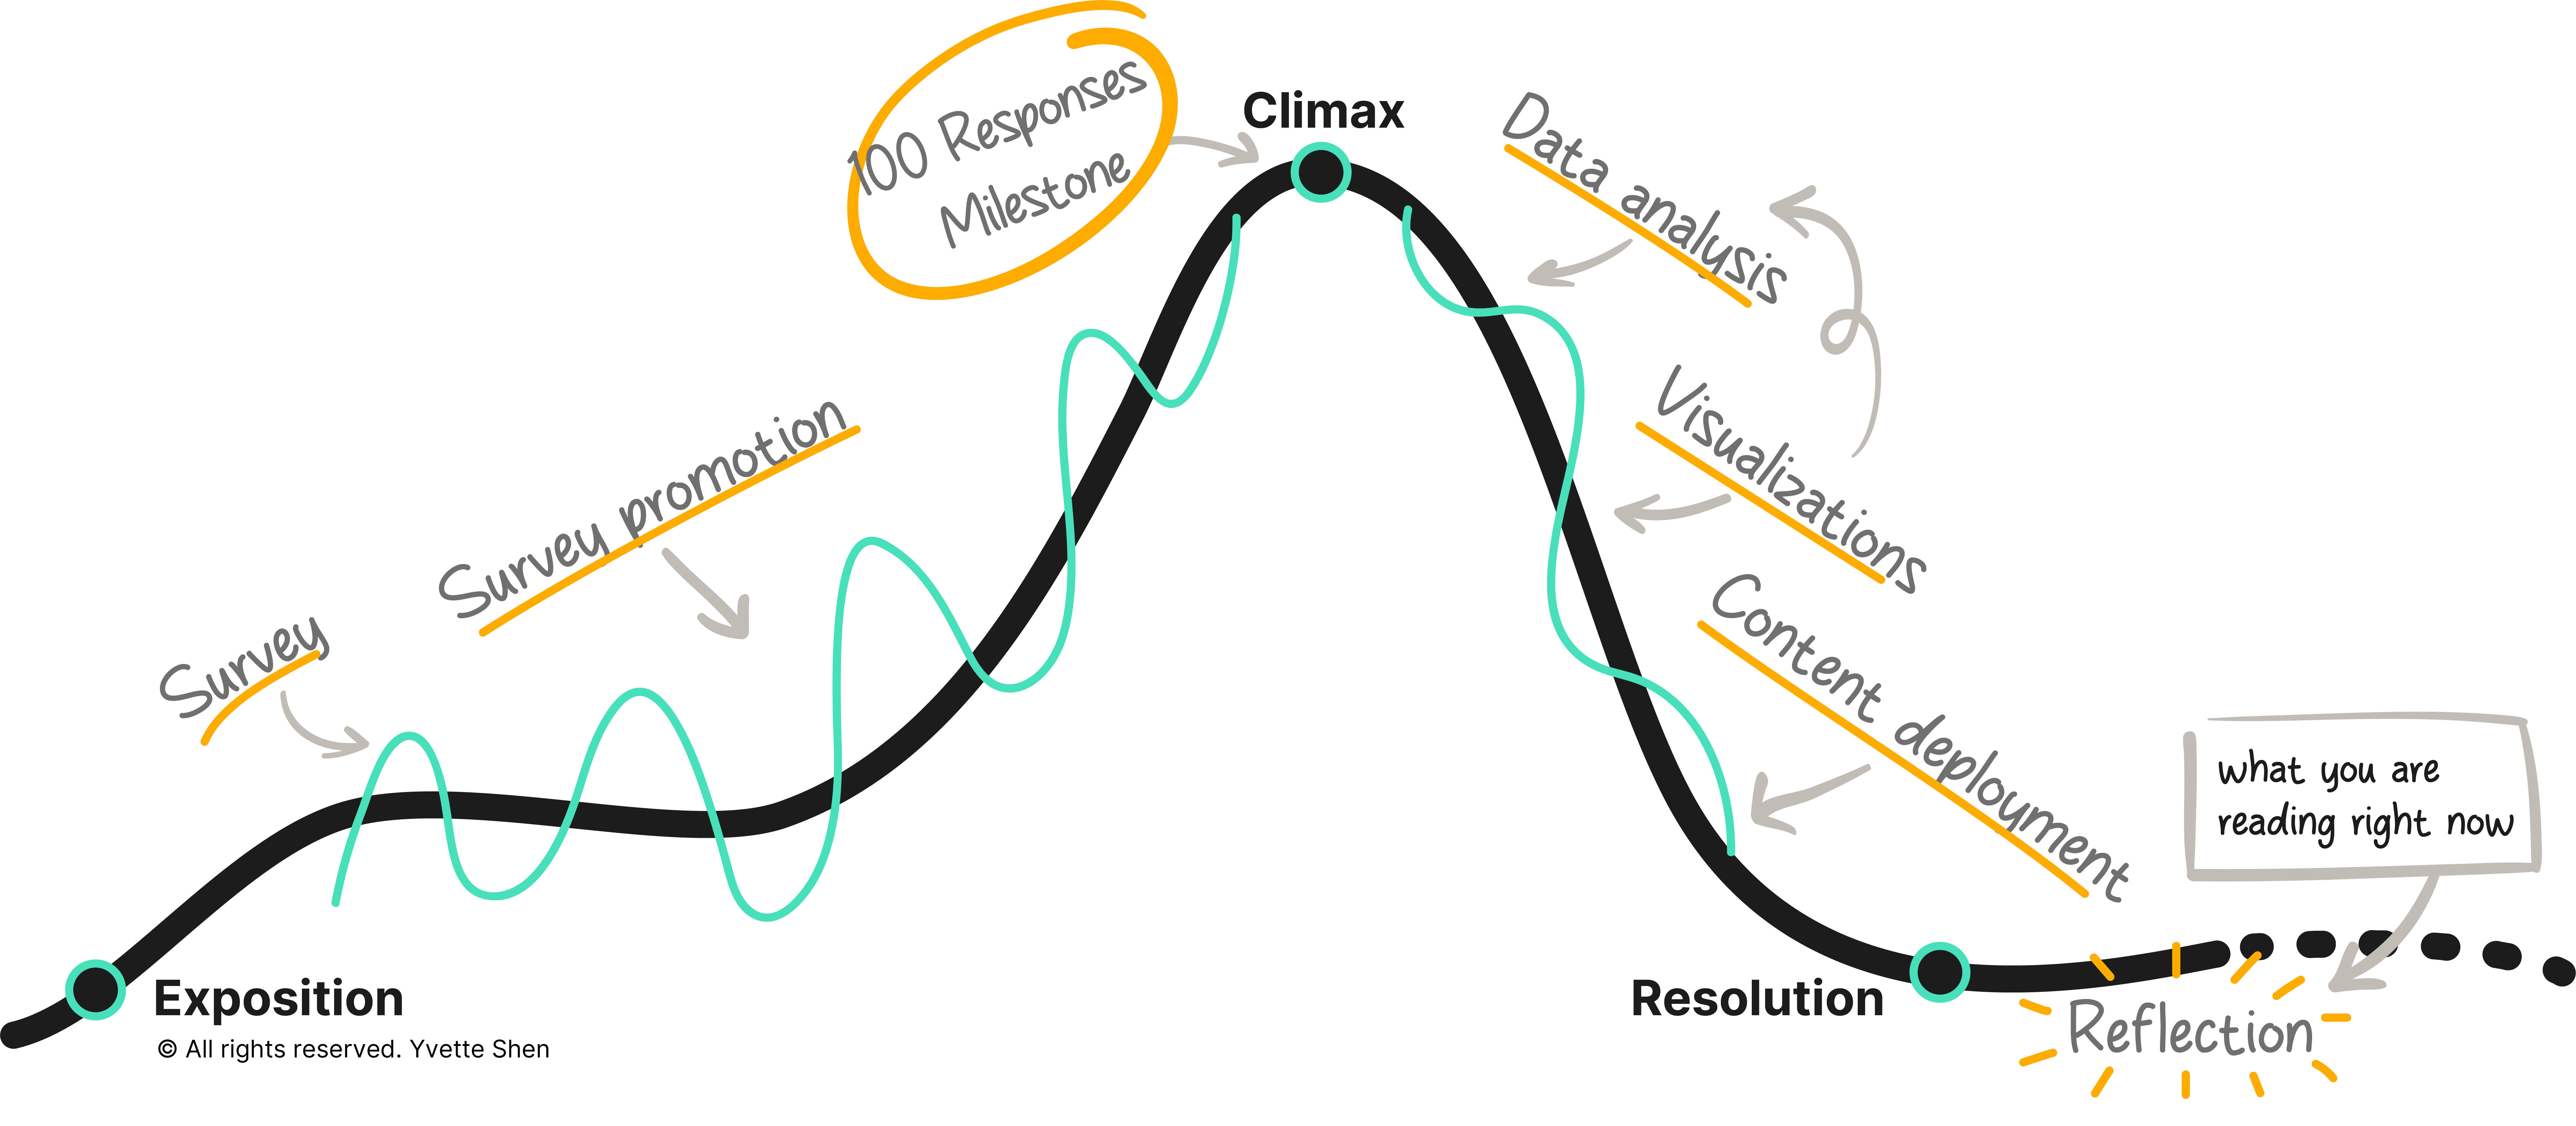
The survey project was initiated by Kyuha Shim in 2022 while he served on the AIGA Design Educators Community(DEC) Steering Committee. It aimed for a holistic assessment of (graphic) design education and a deeper understanding of the role of the design educator. The project received enthusiastic support from members of the steering committee, AIGA, and the AIGA educator community ✊. The survey questions were designed by Kyuha Shim with assistance from members of the DEC Steering Committee.
The survey includes 54 questions, covering a broad spectrum of topics related to the current state of (graphic) design education and the educators.
In the late summer of 2022, Kyuha left the country to continue his career pursuits abroad.
After joining the steering committee, Yvette Shen took the reins of the survey project, with the DEC committee firmly committing to its continuation and completion.
The first survey entry was collected on August 29, 2022. Since then, the DEC has launched promotional campaigns to increase survey participation, including newsletters and social media outreach.
🔛 In August 2023, the survey achieved the milestone of surpassing 100 responses! 🙌 🥳 🎉
The last entry captured before transitioning to the project's next phase was on August 3, 2023, bringing the count to 103 responses. Regrettably, five submissions received after this deadline were not included in the analysis. Following the download of the data sheet, Yvette and her team immediately embarked on the data analysis process.
On October 12, the team presented a "teaser" of the survey results at the AIGA DEC Lens Symposium.
The target audiences are identified as:
The goal of showing and sharing the survey results is:

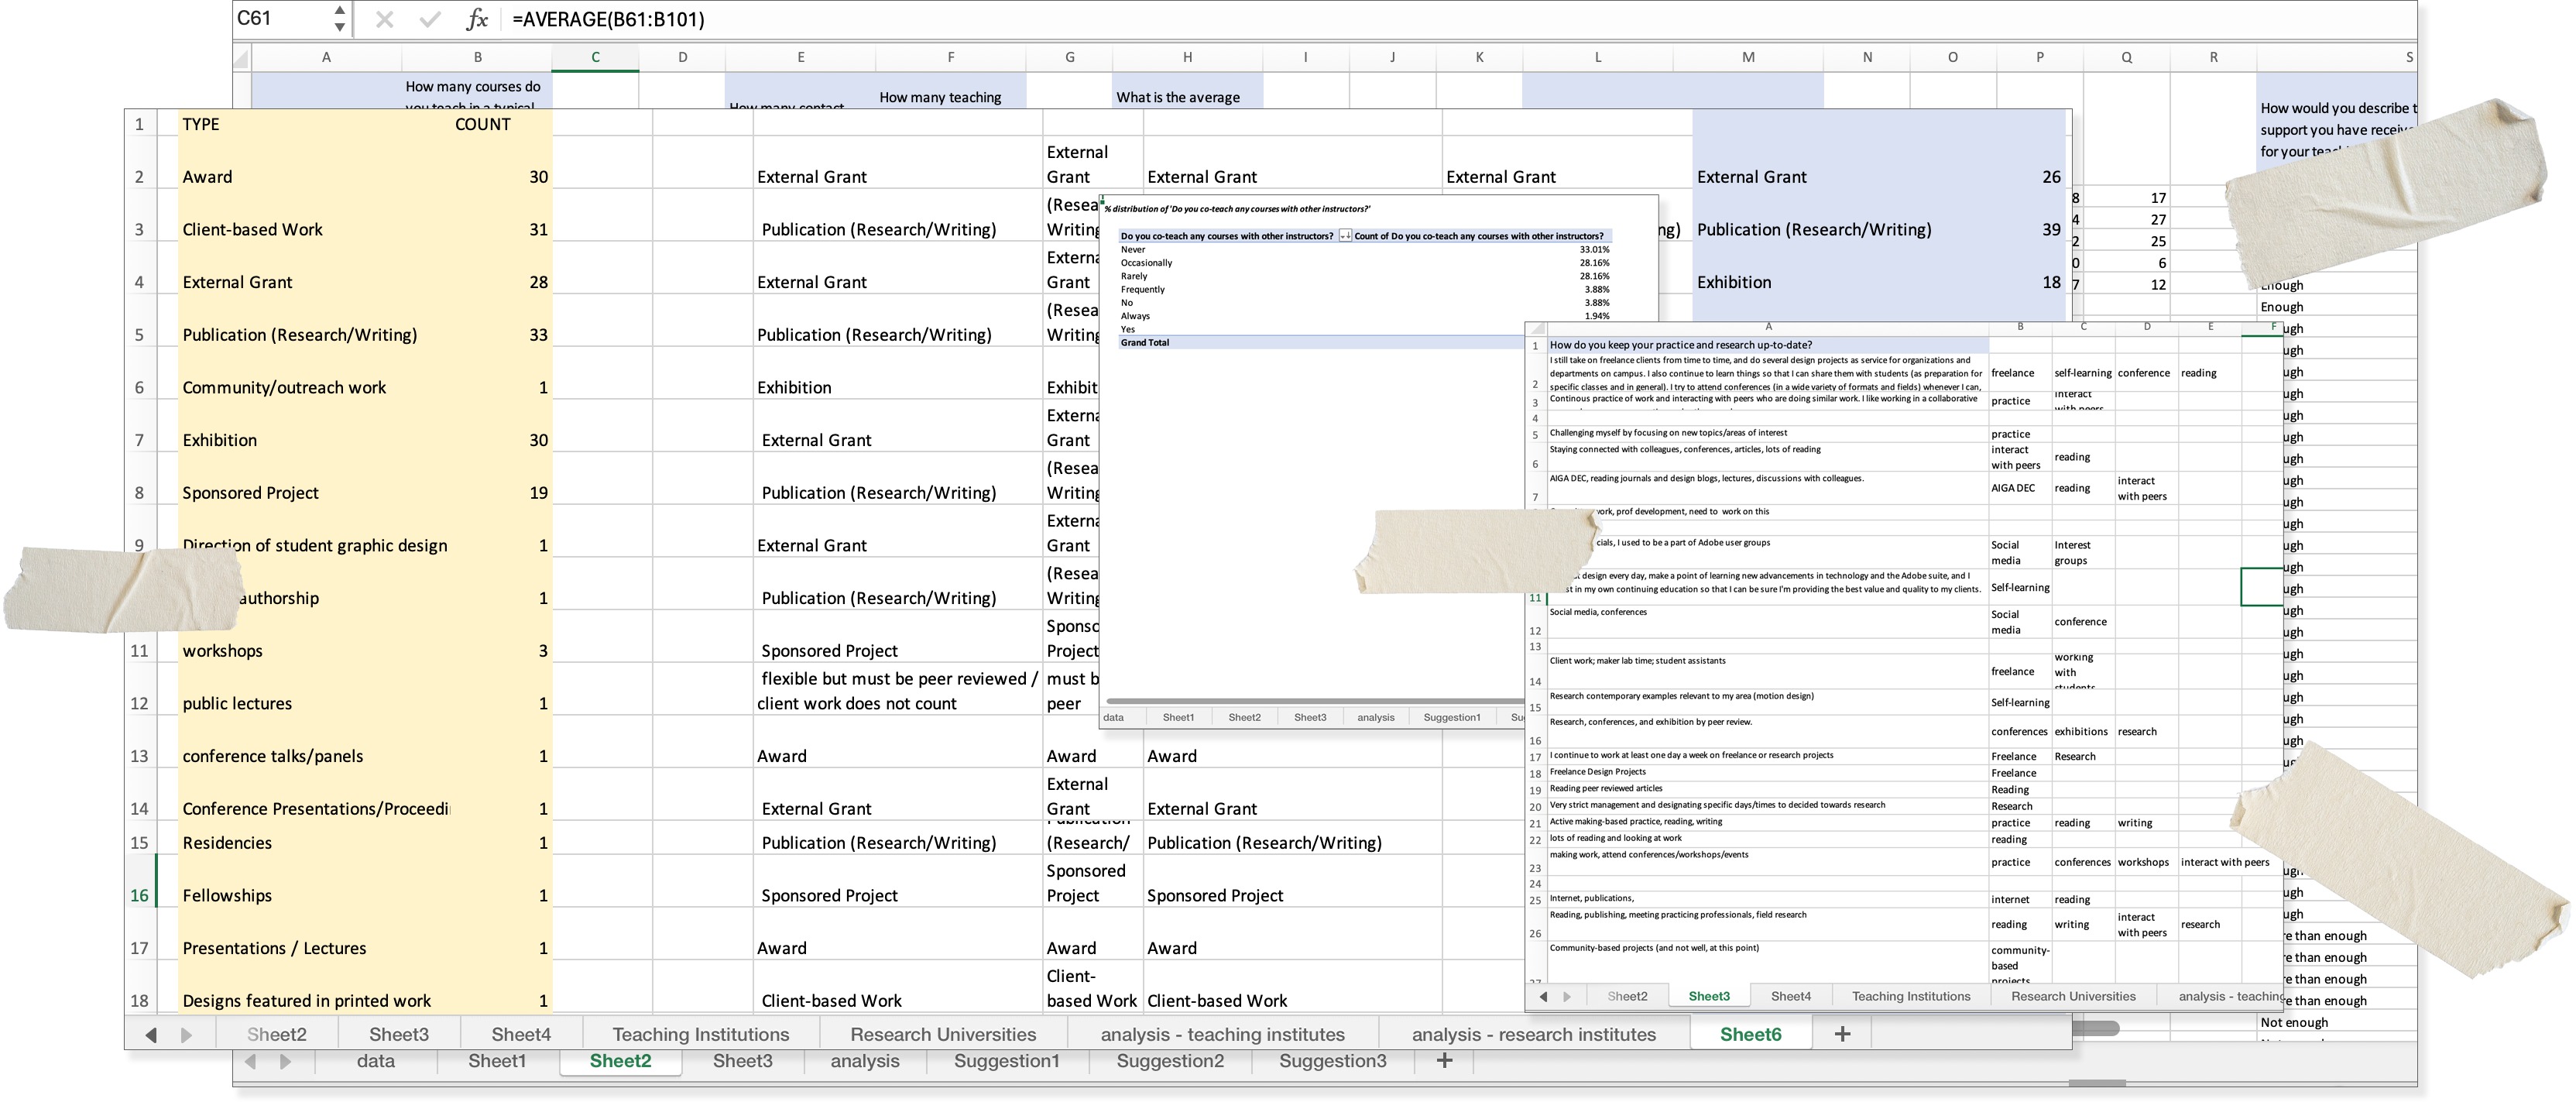
Most quantified data points are analyzed with Excel and Python. The open-ended questions in our survey, represented by a diverse range of qualitative data, usually undergo a hand-coding process first and are then verified by NVivo or Python.


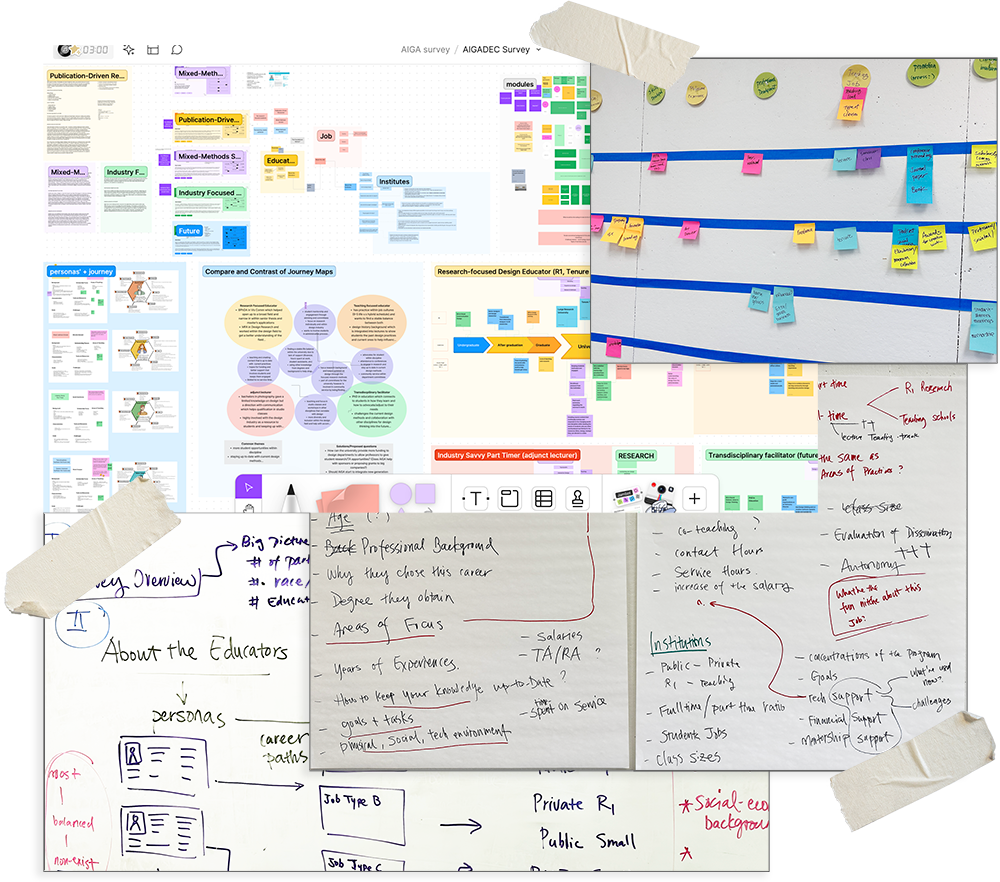
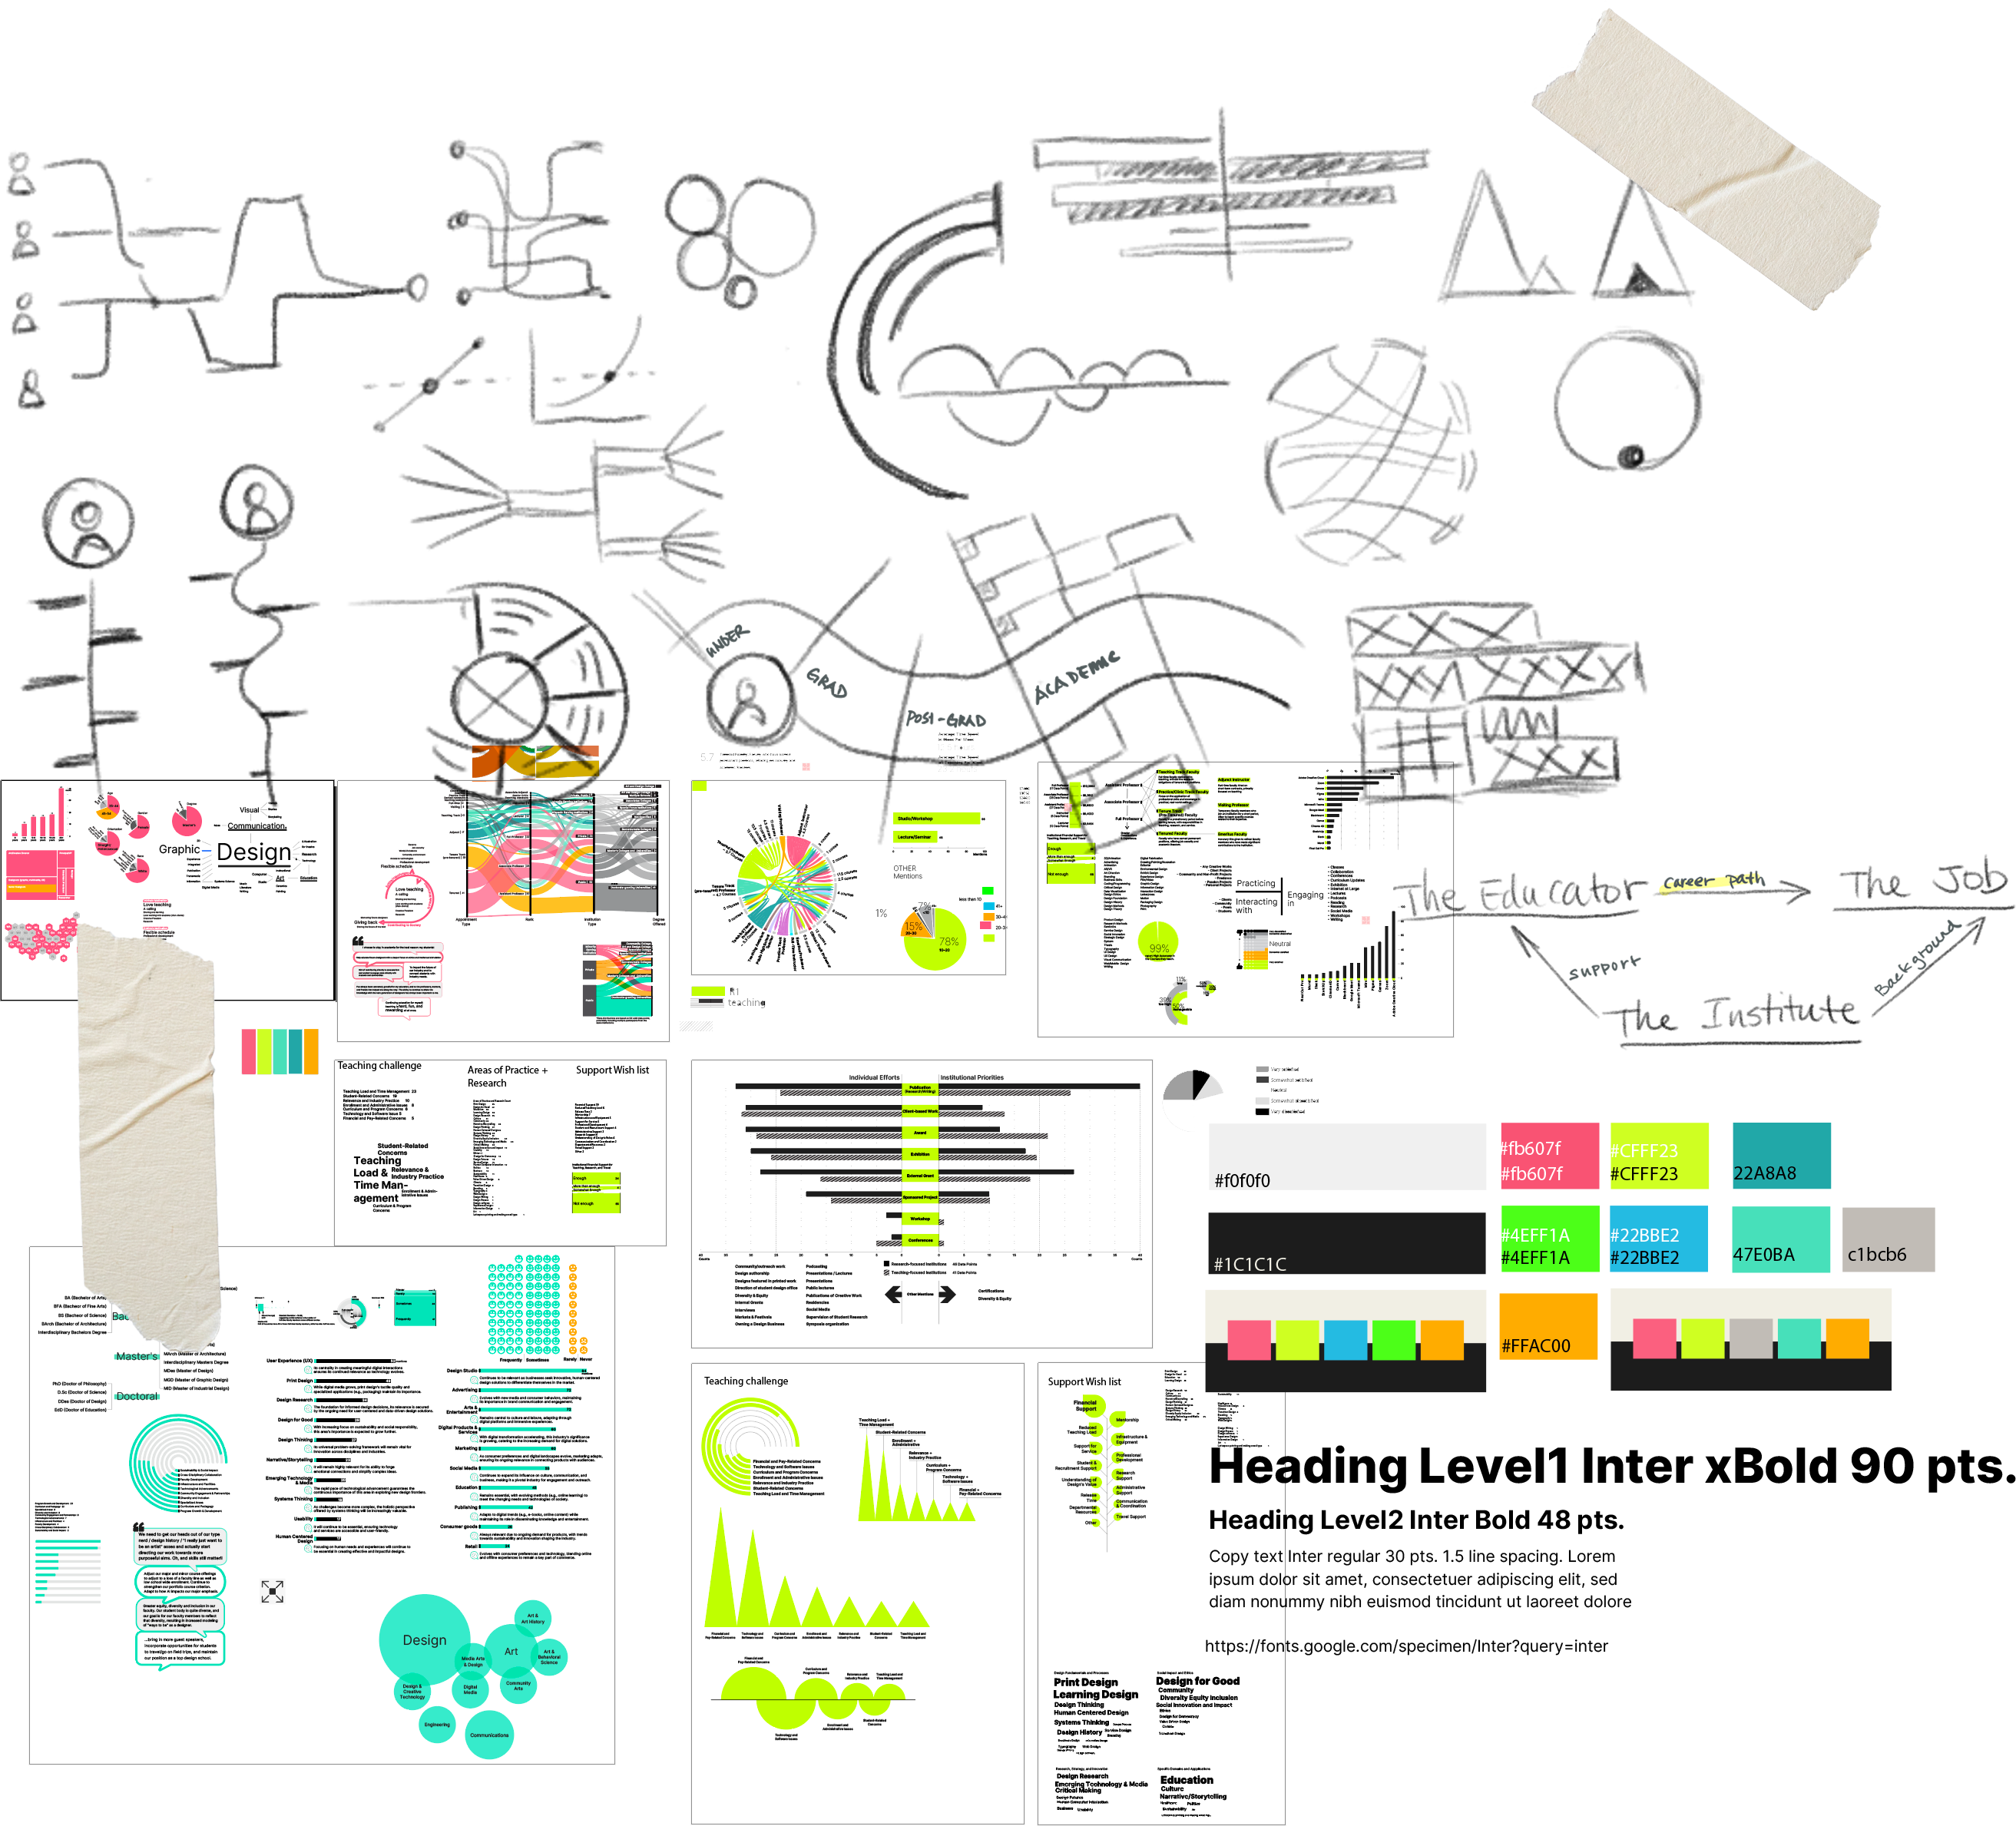
The design process involves a cycle of extensive ideation sessions and rigorous iterative refinement. Recognizing the complexity of translating data into coherent narratives, we posed a critical question at each step: "How might we link data points to create a narrative that's both meaningful and accurate?" Mindful of the pitfalls of bias and misinterpretation, which could occur anywhere from the phrasing of survey questions to the analysis and visualization of data, we took comprehensive measures to ensure reliability and clarity in our presentation.
To offer a more transparent and insightful view of our findings, we incorporated the "Survey snapshots show…" sections throughout the dashboard gallery. These snapshots provide succinct summaries of the data insights, serving as accessible entry points for users. In these sections, the 🤔 emoji acts as a visual cue that leads to extra annotations. These annotations provide additional clarifications and context-specific information.
🔮 What do survey results tell us about design education and educators?
The survey results show that design education is rich with passion and creativity, featuring a dynamic curriculum that closely aligns with industry demands. The curriculum integrates traditional and contemporary subjects, efficiently responding to market needs with a strong emphasis on digital skills and user experience. There is considerable focus on design for good, adopting a human-centered approach, and fostering community and social innovations, which significantly broadening the design landscape. This holistic approach not only harnesses creativity but also equips the next generation of designers to be socially responsible and environmentally conscious. Additionally, the dedication of educators to both personal growth and student development is central to the culture of design education.
The survey highlights key challenges facing design educators, emphasizing the need for improved support structures. These challenges include financial aid, manageable teaching loads, equitable service expectations, and more robust mentorship programs for faculty. The survey results also underscore the need for design curricula to include diverse perspectives and practical applications, promoting interdisciplinary collaboration. It emphasizes the enrichment of students' education through exposure to various ways of thinking. Preparing students for professional realities and building a resilient educational community that requires adaptation to rapidly evolving challenges.
🚀 What could be the next step for advancing design education?
To enhance the landscape of design education, it is crucial to incorporate more diverse voices. AIGA and the broader community can champion diversity among educators and students—across culture, socioeconomic status, identity, disability, age, ideology, neurodiversity, and life experiences—by developing initiatives like scholarships, mentorship programs, and campaigns. Such strategies not only enrich the educational environment by introducing a wider range of perspectives and experiences but also prepare students to enter a global design market with a more inclusive and culturally sensitive approach.
Additionally, fostering collaboration and open communication between the educational sector and the design industry is crucial for the mutual growth of both fields. Initiatives could include creating joint projects that allow students to work on real-world challenges under the mentorship of industry professionals, as well as organizing regular meetings, workshops, and seminars where educators and industry leaders can exchange knowledge, discuss emerging trends, and explore new technologies. These interactions not only bridge the gap between theory and practice, ensuring that the curriculum remains relevant and responsive to the evolving needs of the design profession, but they also provide the industry with insights into futuristic thinking and global concerns, encouraging a shift from a narrow focus to a more holistic view of design's impact on society.
🔒 Data privacy
While the survey project did not apply for IRB approval, the analysis process and the presentation of results were conducted in accordance with IRB standards to ensure the utmost protection of data security and personal information, reflecting our commitment to privacy and ethical research practices.
The modified datasheet, with personal identifiable information removed, is available for access here.
The project team is led by Yvette Shen, who serves as the creative director, designer, analyst, developer, and copy editor, shaping the presentation of the survey results on the web platform.
The project team includes:
We sincerely extend our gratitude 🙏🙏 to Alberto Rigau, Liese Zahabi, Natalie Tyree, Paul Nini, everyone in the past and current DEC Steering Committee, and, most importantly, the 108 design educators who dedicated their time and effort to complete this not-so-brief survey, generously sharing their insights with us.
Our heartfelt appreciation also goes to the modern technologies 💻 and many magical tools that helped bring our vision to life: Adobe Creative Suite, Excel, Figma, NVivo, Python, RawGraph, and ChatGPT.
The project has not received any financial sponsorships. All efforts are driven by our commitment to advancing the field and supporting the design education community.